
A Complete Picture of Your Business
Simple interfaces to uncover insights from complex data.
Achieve predictable growth.
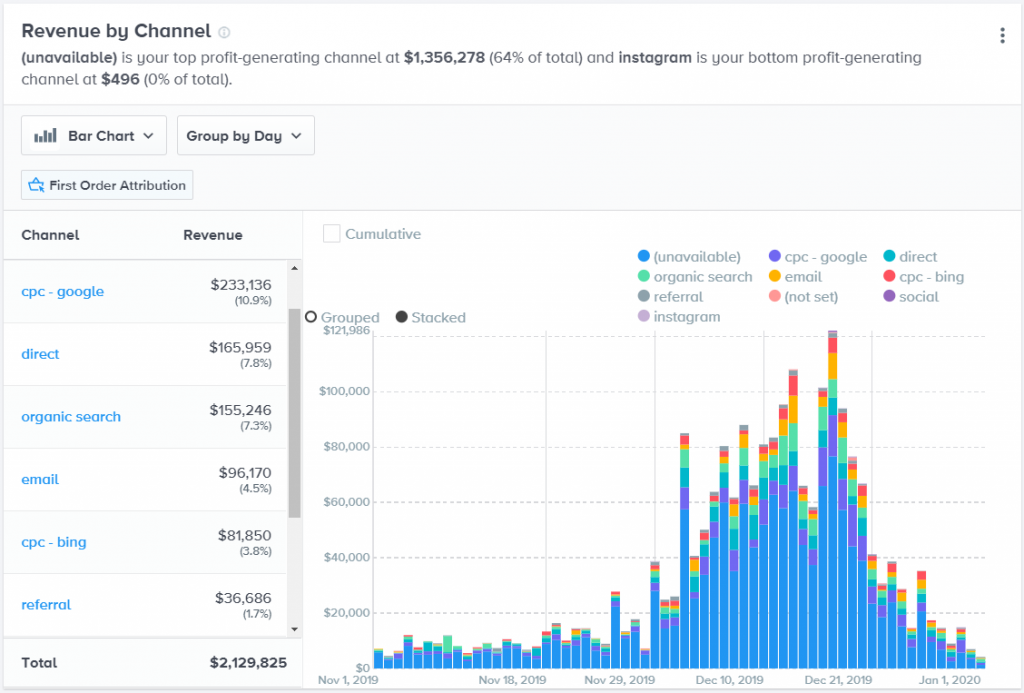
Smart dashboards pull data from multiple integrations to show your company’s key performance indicators such as Revenue, Average Order Value, and Conversion Rate.
Gain a deep understanding of your customer acquisition costs and what channels are driving profitability by comparing the right metrics.
Find high-level patterns in customer behavior and uncover ways to maximize your revenue.
Gain a deep understanding of your customer acquisition costs and what channels are driving profitability by comparing the right metrics.
Find high-level patterns in customer behavior and uncover ways to maximize your revenue.
Optimize channel performance.
Stop spending time logging into multiple advertising platforms and analyzing piecemeal data or exporting it all to an offline spreadsheet.
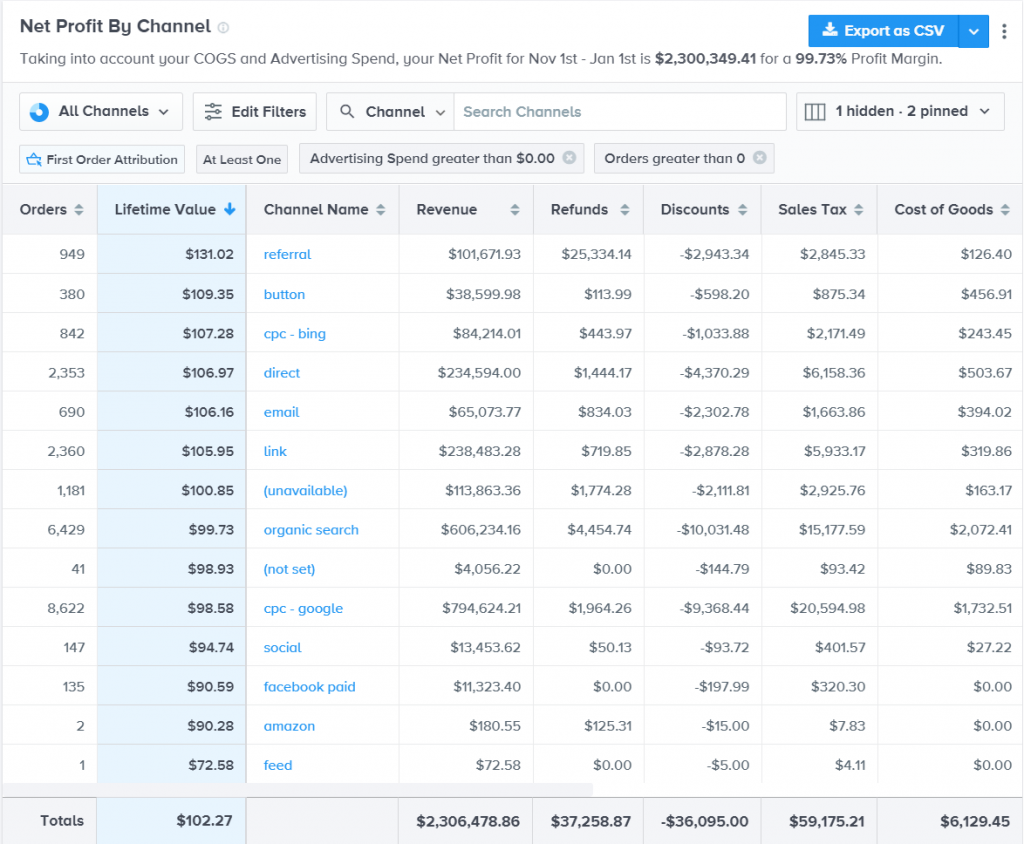
Sort all of your acquisition channel data by metrics that matter, like revenue, net profit, and average customer lifetime value.
Make decisions about which advertising sets are performing, juxtaposed against your email campaigns and surveys.
Sort all of your acquisition channel data by metrics that matter, like revenue, net profit, and average customer lifetime value.
Make decisions about which advertising sets are performing, juxtaposed against your email campaigns and surveys.
More engagement, less effort.
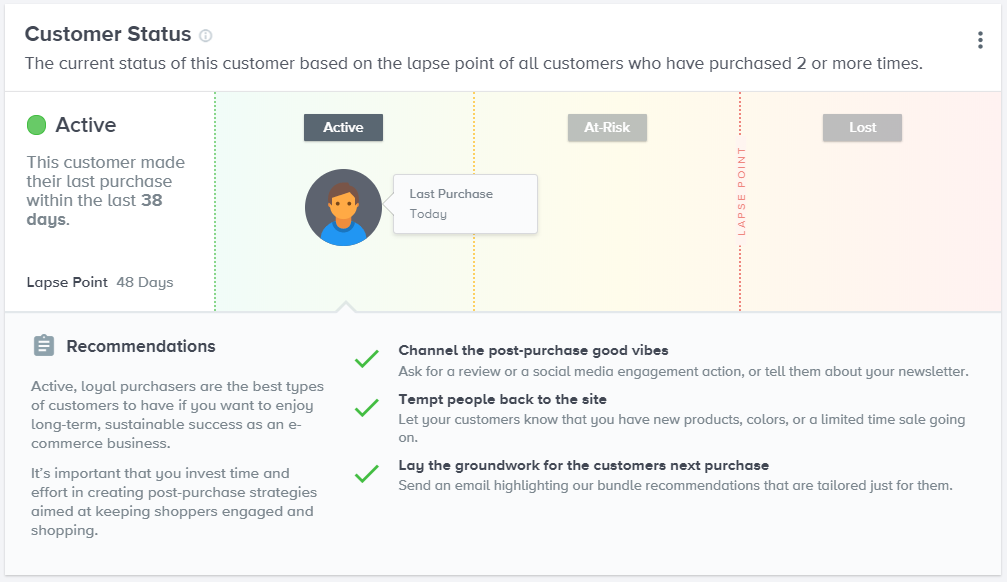
Make the most out of your customer list by identifying powerful trends in purchasing habits across every customer’s lifecycle with your business.
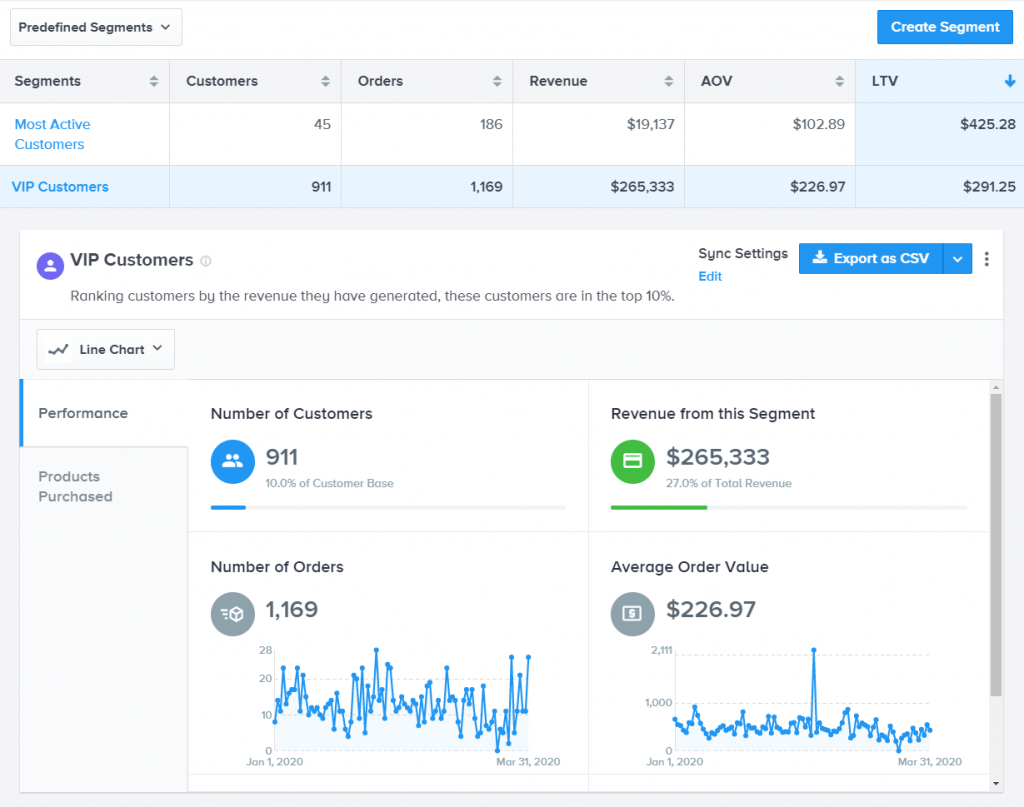
Automatic customer segmentation uncovers the features of your most active customers so you can scale what’s working and drop what isn’t.
Smart product recommendations show you what to put in front of who based on what similar customers have purchased.
Automatic customer segmentation uncovers the features of your most active customers so you can scale what’s working and drop what isn’t.
Smart product recommendations show you what to put in front of who based on what similar customers have purchased.
Effortlessly design and test pricing.
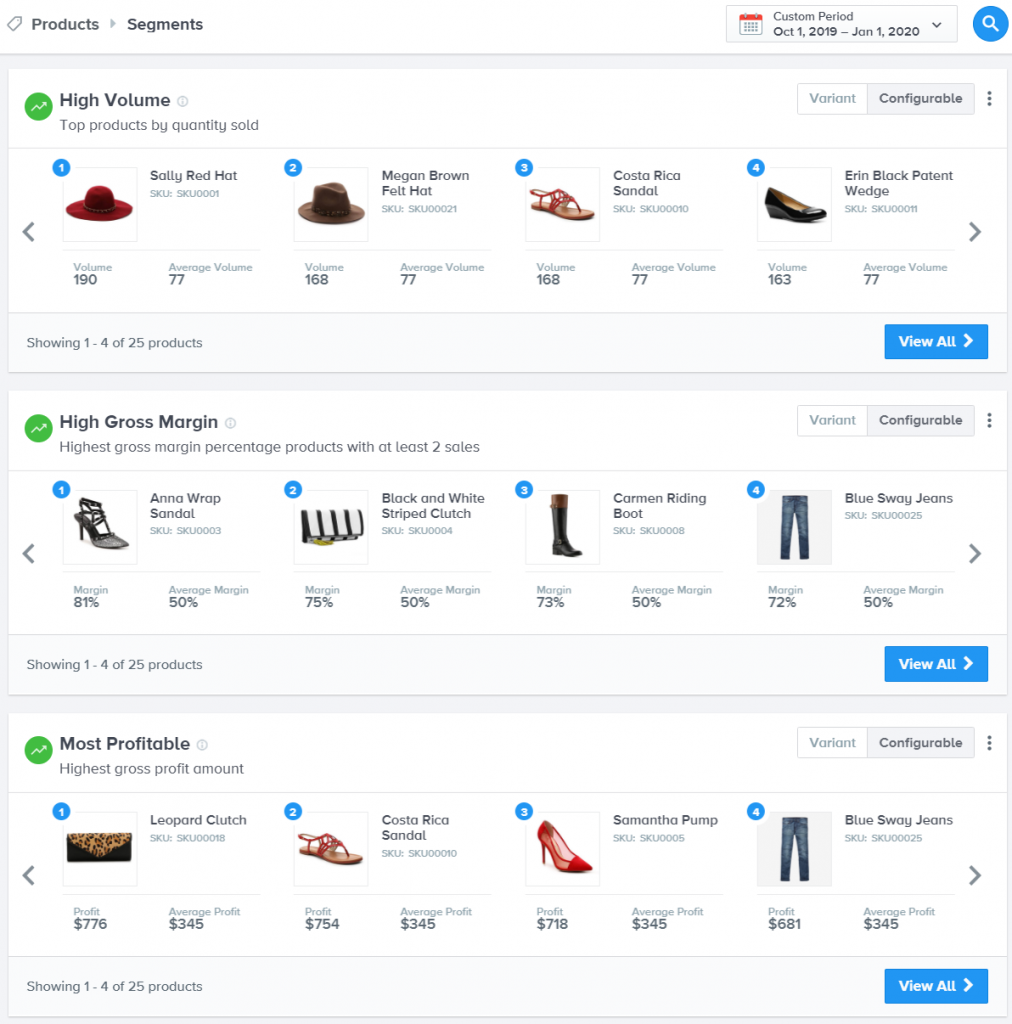
Transform your product data from unmanageable tables to a serious revenue generator. Smart product segmentation groups products into segments you care about, like most profitable and most purchased with a discount.
Uncover pulls in the categories you’ve set up in your e-commerce platform, allowing you to compare your categories your way.
See your best bundles or drill down into individual product pages to uncover key product performance insights.
Uncover looks at more than just sales. Monitor your costs of goods sold, inventory velocity, and depletion to track the best products to stock over time.
From one-time to lifetime orders.
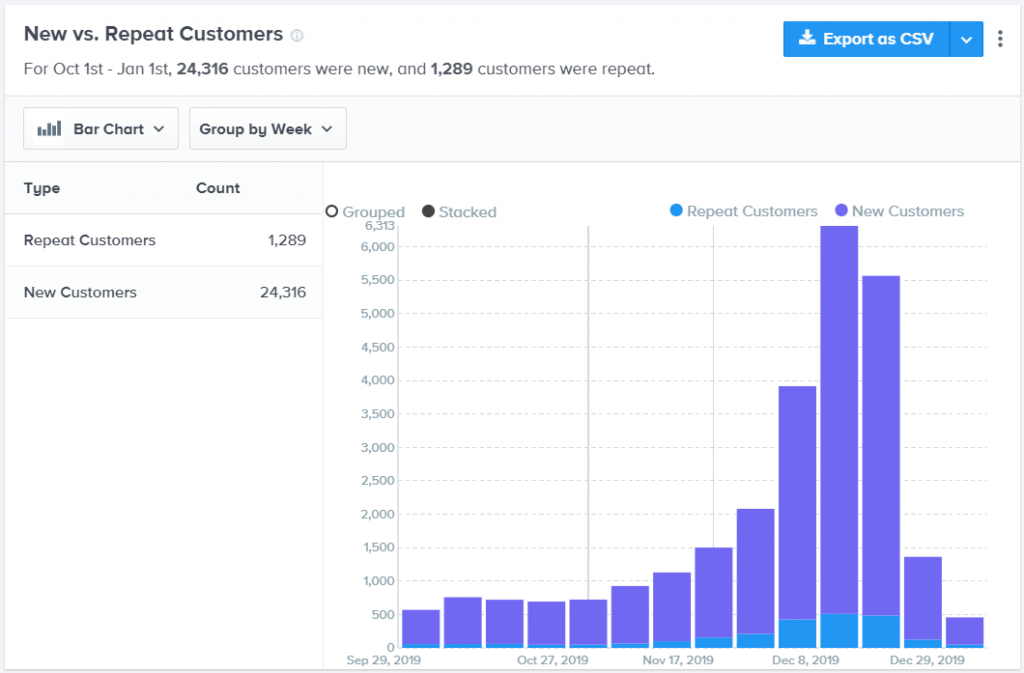
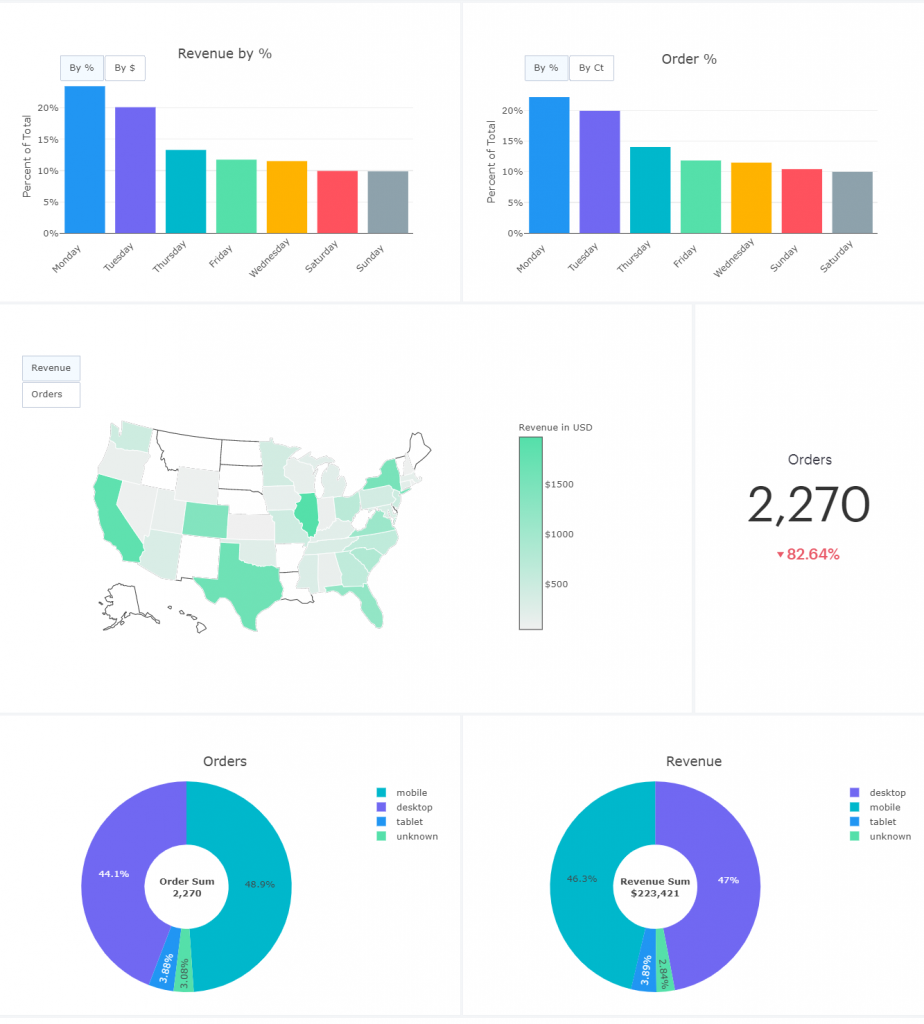
See which channels and campaigns are bringing in new customers versus driving repeat business. Drill down even further to see customer acquisition and retention by device, day of the week, and metro.
Identify the average number of days it takes for a customer to buy again and time your calls to action to maximize customer lifetime value.
Period-over-period comparisons of channel and campaign performance highlight what’s working and what isn’t.
Identify the average number of days it takes for a customer to buy again and time your calls to action to maximize customer lifetime value.
Period-over-period comparisons of channel and campaign performance highlight what’s working and what isn’t.
Customizable and comprehensive reporting.
Stay on top of business goals and performance through scheduled e-commerce reporting. Add any charts to a new or existing report that can be viewed on-screen, offline, or emailed to anyone, even if they don’t have Uncover.
If there are certain metrics you follow regularly, you can customize a report and schedule it for recurring delivery. For one-time analyses, Uncover lets you send any report once you finish it, or save it for later.
Reports can even be sent with customizable headers, footers, and tables of contents for that final professional touch.
Uncover Pro
Need to Uncover more than what comes out of the box? Uncover Pro takes e-commerce analytics to the next level.
Access dozens of additional integrations, like Criteo, Snapchat, Listrak, and HubSpot.
Give need-to-know access to analytics and reports through an enterprise report viewer with custom user groups and permissions.
Build multi-store reports to uncover insights across your entire enterprise.
Get access to the Uncover Pro team to build custom reports and functionality to visualize data exactly how you need it to grow.
Copyright © 2020. All Rights Reserved.